
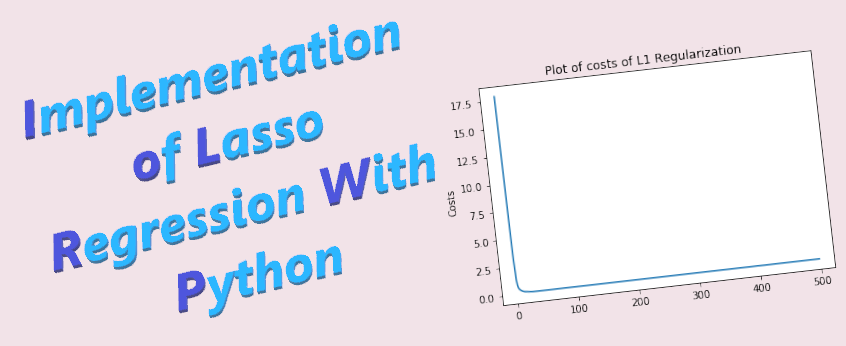
Hi Everyone! Today, we will learn about Lasso regression/L1 regularization, the mathematics behind ridge regression and how to implement it using Python! To build a great foundation on the basics, let’s understand few points given below: Firstly, let us have a look at the Sum of square of errors function, that is defined as It […]
Category: Data Visualization

Ridge Regression and its Implementation with Python
Hi Everyone! Today, we will learn about ridge regression, the mathematics behind ridge regression and how to implement it using Python! To build a great foundation on the basics, let’s understand few points given below: Firstly, let us have a look at the Sum of square of errors function, that is defined as It is […]

Implementing Moore’s Law Using Python
Hi All! Today, we will learn how to implement Moore’s Law Using Linear Regression in Python. Before going through this tutorial, it is highly recommended to go through the mathematics behind this tutorial. Moore’s law states that in an Integrated Circuit, the transistor count doubles every year or transistor count, Y = a*2^X where a […]

Data Visualization Using Matplotlib: Part 1
Hi ML enthusiasts! Today, we will learn about visualizing data using the matplotlib library of Python. Data Visualization is very important in the field of data science. When we are dealing with so much data, it becomes a necessity to visualize that data so that we can interpret and analyze the data effectively. Visualizing data […]