

Clustering using Scatter-chart in Power BI In this video, you will learn how to do clustering in power BI using scatter-chart. The data-set that we have used in this video can be found here – Kaggle To stay updated and to get notification of new video tutorials SUBSCRIBE to our YouTube channel ML for […]
Category: Data Visualization

Prediction of Quality of Wine
We alsways thought, that “How we can predict quality of Wine?”, in this project we are going to solve that question only. We will be using a Red-Wine data set being provided on Kaggle, can be found at “https://www.kaggle.com/vishalyo990/prediction-of-quality-of-wine/data“. It contains 12 columns or features describing the chemical composition of Wine and its Quality score […]

Random Forests Using R: Titanic Case Study
Hi MLEnthusiasts! Today, we will learn how to implement random forests using R that too on a well-known dataset, The Titanic Dataset! So, our analysis becomes by getting some information about the dataset, like what all variables are in our dataset and what do we have to predict. This tutorial will make you know how […]

Decision Trees Using R: Titanic Case Study
Hi MLEnthusiasts! Today, we will dive deeper into classification and will learn about Decision trees, how to analyse which variable is important among many given variables and how to make prediction for new data observations based on our analysis and model. Again, we will continue working on the titanic dataset. This will serve our two […]
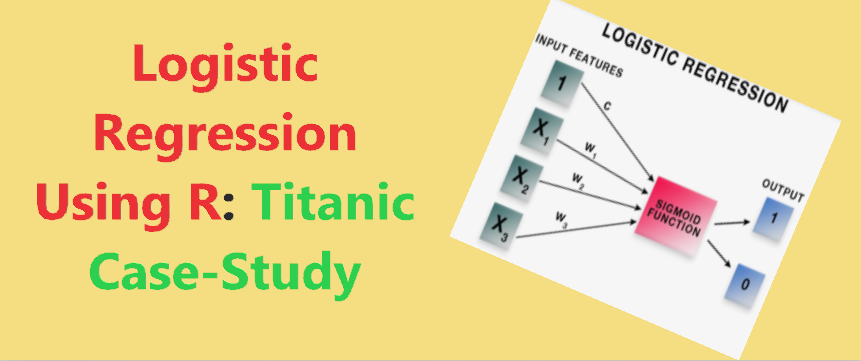
Logistic Regression using R: Titanic Case study
Hi MLEnthusiasts! Today, we will learn how to implement logistic regression using R that too on a well-known dataset, The Titanic Dataset! So, our analysis becomes by getting some information about the dataset, like what all variables are in our dataset and what do we have to predict. The model gives 80.02% accuracy on train […]