
Hi Everyone! Today, we will learn about the concepts of expected value, variance and standard deviation. We will also learn about their implementation using MS-Excel.
Consider a firm M which has collected the data of profits and the probability of their occurrence. The profits can be taken in the scale of 1000’s of $. We will take this data for our further analysis.
Expected value
Expected value, or mean, can be defined as the measure of the central value of the random variable. It has the following formula.
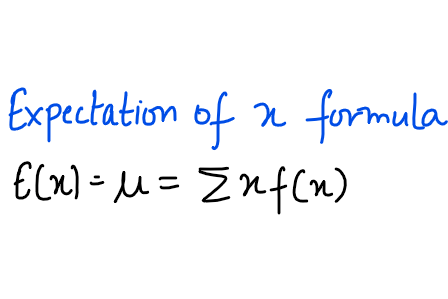
Here, x is the value of random variable and f(x) is the values of probabilities of their occurrences. Thus, we can say that excepted value of x is the weighted average of the values of random variable with the weights as their probabilities. Please note that it is the central tendency of the random variable under consideration. It is not a hard-and-fast rule that it has to be the value which x assumes.
Implementation using MS-Excel
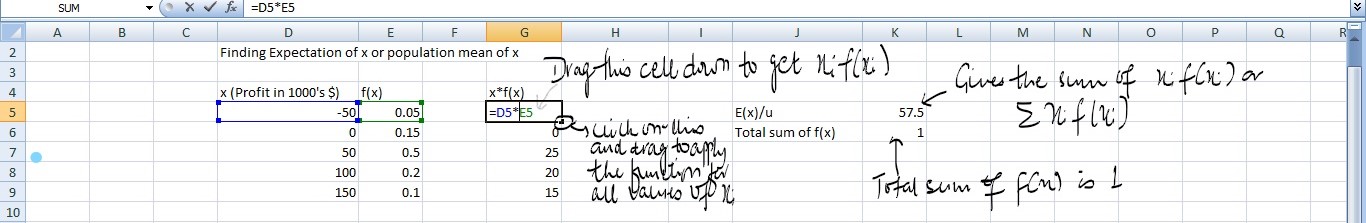
- The first step is to collect the data. The given data consists of two columns, x and f(x). Make the third column and given it the heading x*f(x).
- In the observation 1 of this third column, write the expression =<observation 1 of row x>*<observation 1 of f(x)> and then press enter.
- Drag the cell down to apply the formula for all the values of x.
- Now, apply the sum() function to all the observations of this third column and this gives the expected value or mean of x. To do this, select a cell. write =sum(<data>) and then press enter. For select the data, click on the first observation of third column, press ctrl+shift+down key and then press enter. This gives the E(x) value of x.
Variance and its implementation using MS-Excel
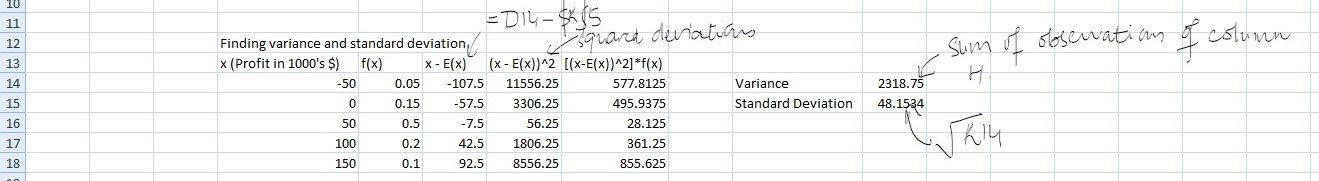
Variance can be defined as the measure of weighted average of square of deviation of random variable from its expected value or mean. The weights here are probabilities of x. The formula of variance is as follows:

To implement this function using excel, subtract mean from each value of x and then square it using ()^2 and then multiply each squared value with f(x). After this, find the total sum using the sum function.
Standard Deviation
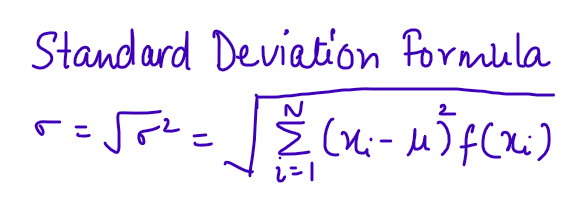
It is the square root of variance. It gives us an estimate of how far are the values of random variable distributed from the mean.
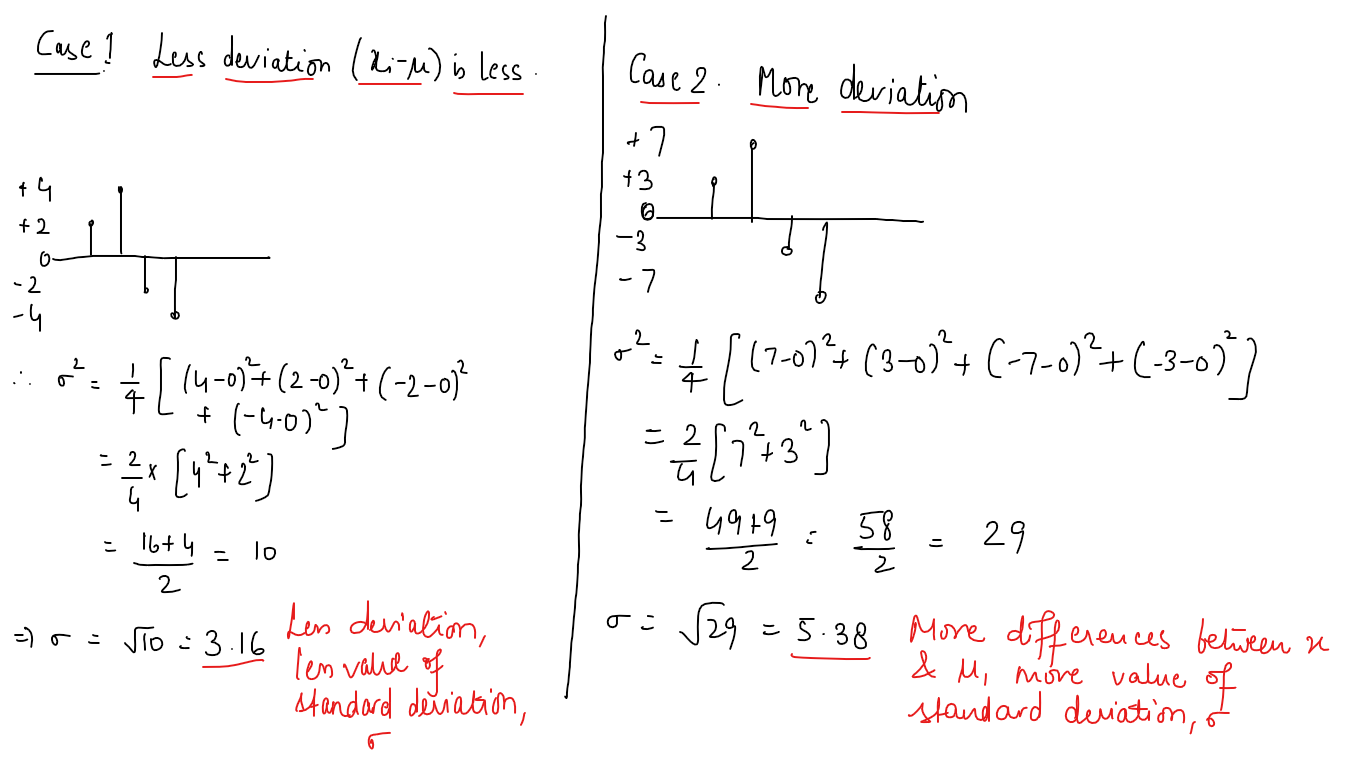
Why square the differences?
For a random variable having values which are equally likely or having same probability of occurrence or f(x) being equal for each value of x, the values of x-µ being both positive and negative and with these values multiplied by f(x), when this product is summed up, the outcome will come out to be zero. That states, there is no deviation at all! But, that’s not true. Thus, we square the differences and then multiply those squared differences with f(x) and then find the square root of all the summed values. This gives us a better idea of standard deviation. The below image explains this phenomenon:
It is to be noted that if we don’t square the differences, the sum will come out to be zero.
So guys, with this we conclude our tutorial. In the next tutorial, we will learn about binomial probability distribution and its implementation using MS-Excel.
Stay tuned!


